| dc.contributor.author | Gjertsen, Karen E. | |
| dc.date.accessioned | 2020-12-09T09:29:24Z | |
| dc.date.available | 2020-12-09T09:29:24Z | |
| dc.date.created | 2020-12-03T11:44:44Z | |
| dc.date.issued | 2020 | |
| dc.identifier.uri | https://hdl.handle.net/11250/2712536 | |
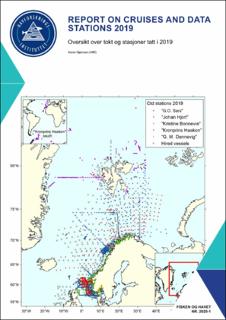
| dc.description.abstract | The report gives an overview of cruises in 2019, by the Institute of Marine Research, University of Bergen and Tromsø and Norwegian Polar Institute, Tromsø on board our research vessels and many of the hired commercial vessels. Each cruise is described by a short description and a track chart mainly showing CTD, plankton and trawl stations. The coverage of the oceanographic sections is listed in a table. Another table shows the number of observations per month for the fixed stations. Meta data about the cruises are reported to the International Council for the Exploration of the Sea (ICES) using the form “Cruise Summary Report”: http://www.seadatanet.org/Metadata/CSR. Research data are available from the Norwegian Marine Data Centre at Institute of Marine Research. The charts can internally at IMR be downloaded from the Institute Intranet/Archive: https://mediearkiv.hi.no/ Charts are made by Karen E. Gjertsen. Sebastian Bosgraaf made charts for “G.M.Dannevig”. | en_US |
| dc.language.iso | eng | en_US |
| dc.publisher | Havforskningsinstituttet | en_US |
| dc.relation.ispartof | Fisken og Havet | |
| dc.relation.ispartofseries | Fisken og havet;2020 - 1 | |
| dc.relation.uri | https://www.hi.no/hi/nettrapporter/fisken-og-havet-en-2020-1 | |
| dc.title | Report on cruises and data stations 2019 | en_US |
| dc.title.alternative | Oversikt over tokt og stasjoner tatt i 2019 | en_US |
| dc.type | Research report | en_US |
| dc.description.version | publishedVersion | en_US |
| dc.source.pagenumber | 210 | en_US |
| dc.source.issue | 2020 - 01 | en_US |
| dc.identifier.cristin | 1855752 | |
| cristin.ispublished | true | |
| cristin.fulltext | original | |